Product guide
How to load test from the Loadcurl dashboard
On this page
01Open the Loadcurl dashboard
Go to app.loadcurl.com — that is the app. Home is the composer, quota cards, and run history. Billing, Wallet, Profile, and Settings are in the sidebar. Company workspaces also get Organization.
If you already have an account, sign in. Otherwise create a free account. A personal workspace is created for you; you do not need to create an organization to run tests.
02Register or sign in
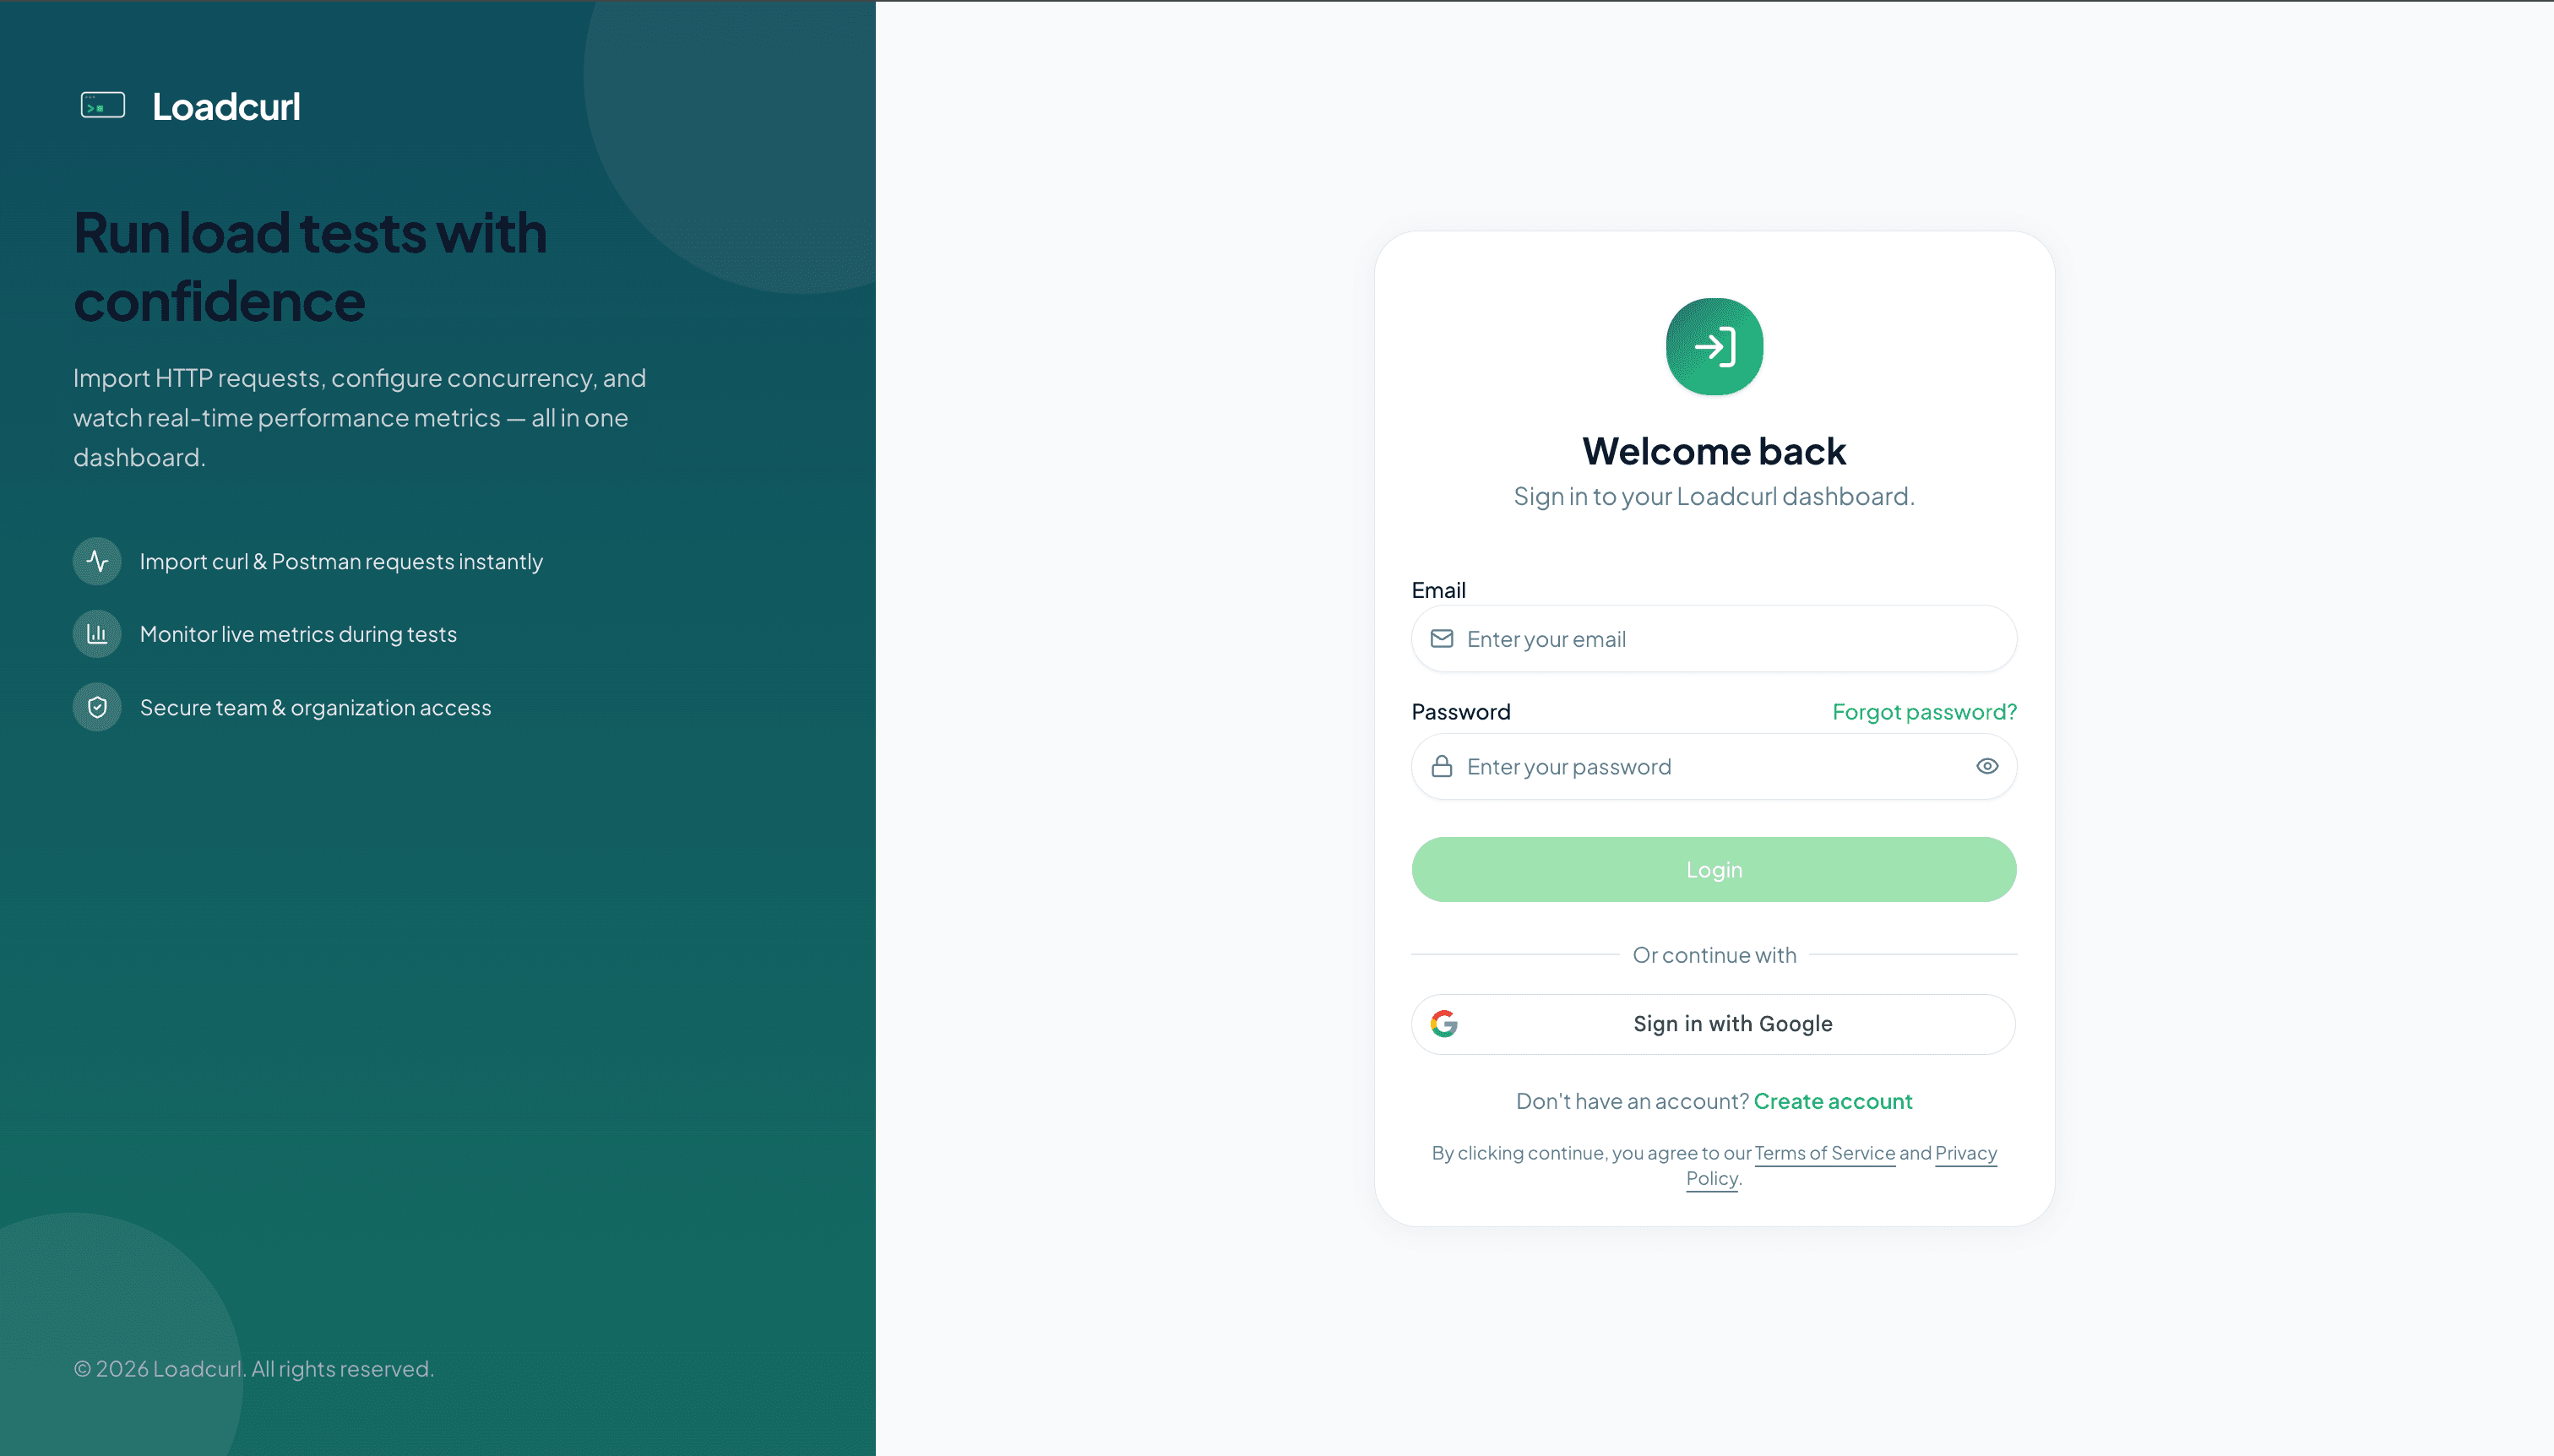
Use email and password or continue with Google. New users register with name, email, and password, then verify the inbox (Settings → Email verification if you need to resend). Forgot and reset password stay available even when you are signed in; login and register redirect to Home instead.
After sign-in you land on Home: summary cards (including remaining quota), the request composer, and run history.
03Personal workspace, then upgrade to company
You start on a personal workspace (named like Your name's workspace). Rename it in Settings. To invite teammates, click Upgrade to company, enter a company name, and confirm. This cannot be undone. You can remain the only member.
After upgrade, Organization appears in the sidebar (company workspaces only). Owner and Admin invite by email as Admin or Member. The teammate accepts from the invite link. Accepting parks the invitee's personal workspace; leaving the company restores it. One active workspace per user.
- Settings → Upgrade to company (personal Owner only).
- Inviting someone from a personal workspace also converts it to a company.
- Roles are Owner, Admin, and Member — not Viewer or Tester.
- Request wallet, tests, and subscription are shared in a company.
04Configure your API request
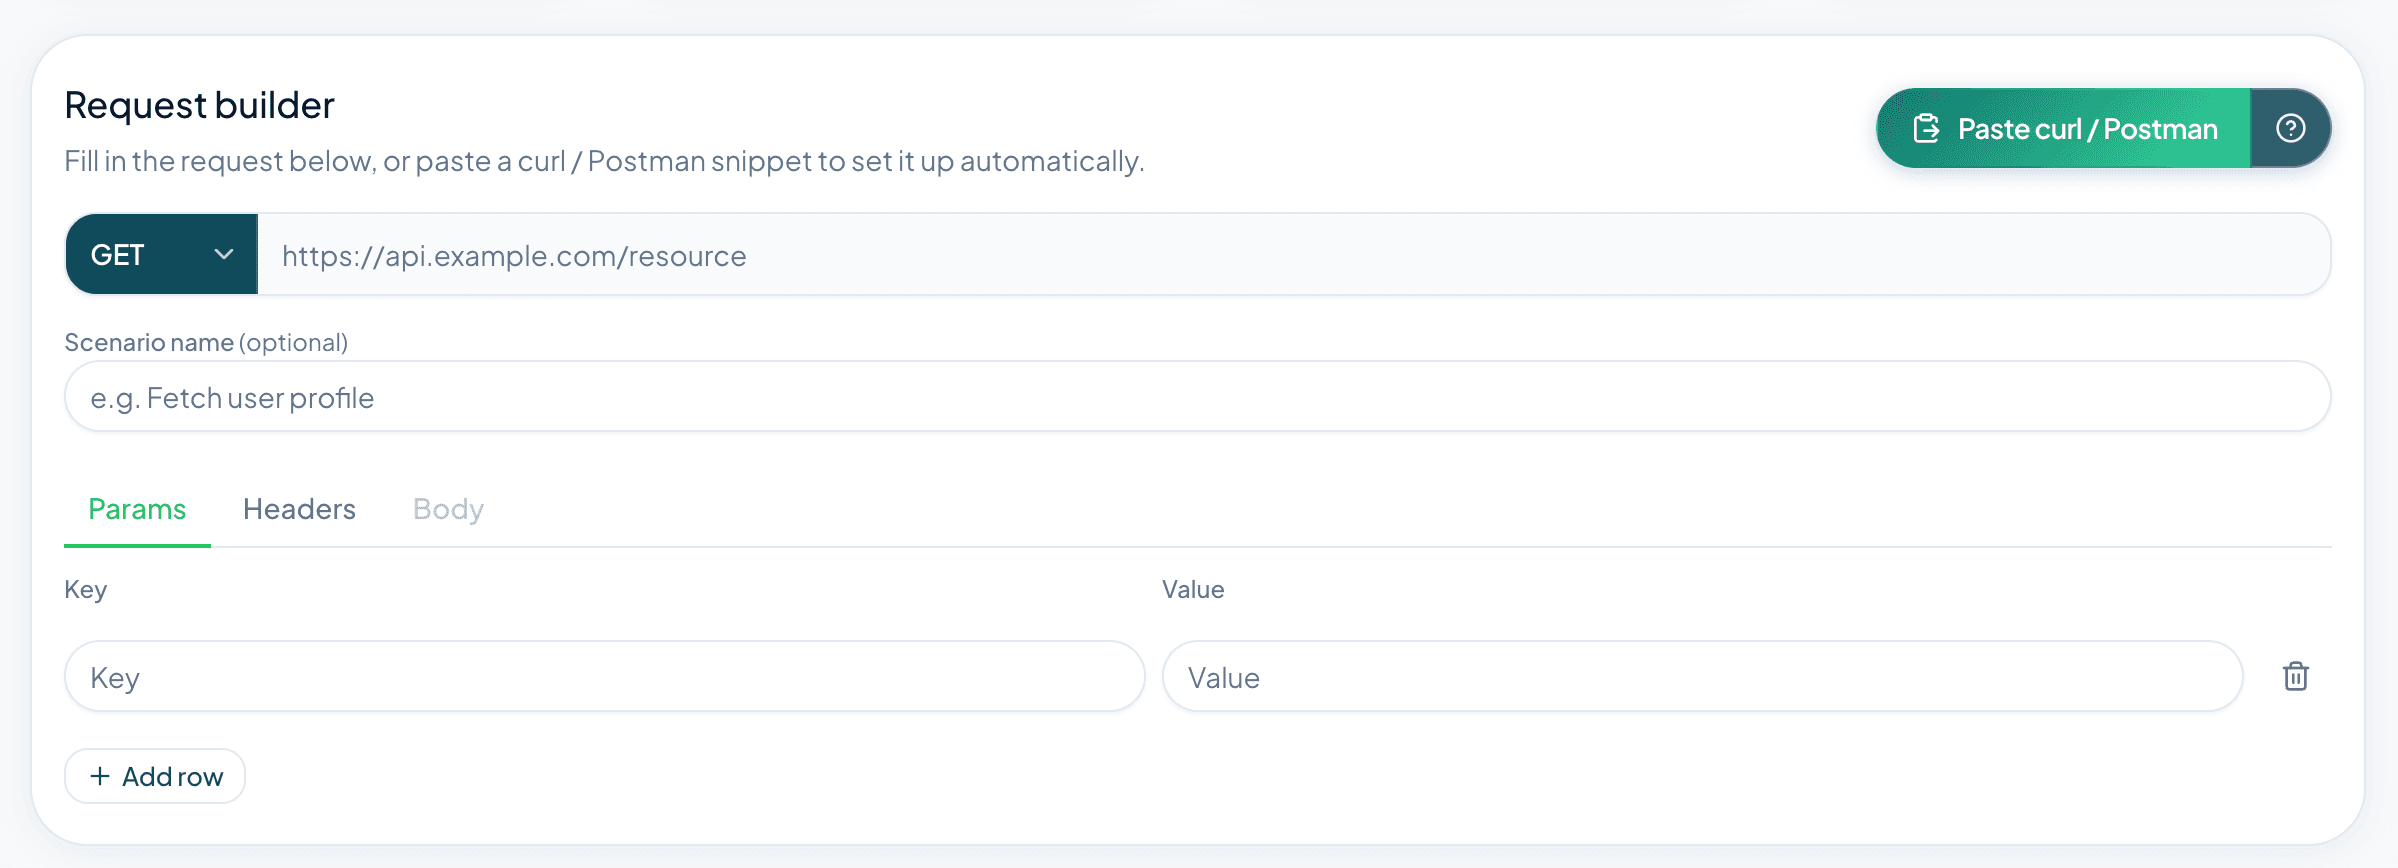
On Home, use the composer. Fill the form or paste a curl / Postman snippet.
Set HTTP method and URL, optionally name the scenario, then use Params, Headers, and Body. Body must be a JSON object for POST, PUT, or PATCH.
- Method & URL — GET, POST, PUT, PATCH, or DELETE and a full http(s) URL.
- Scenario name — optional label in history.
- Params — query string key-value pairs.
- Headers — Authorization, Content-Type, and custom headers.
- Body — JSON object payload when the method supports it.
Params
Add query string key-value pairs sent with the request.

Headers
Set authentication tokens, Content-Type, and custom headers.

Body
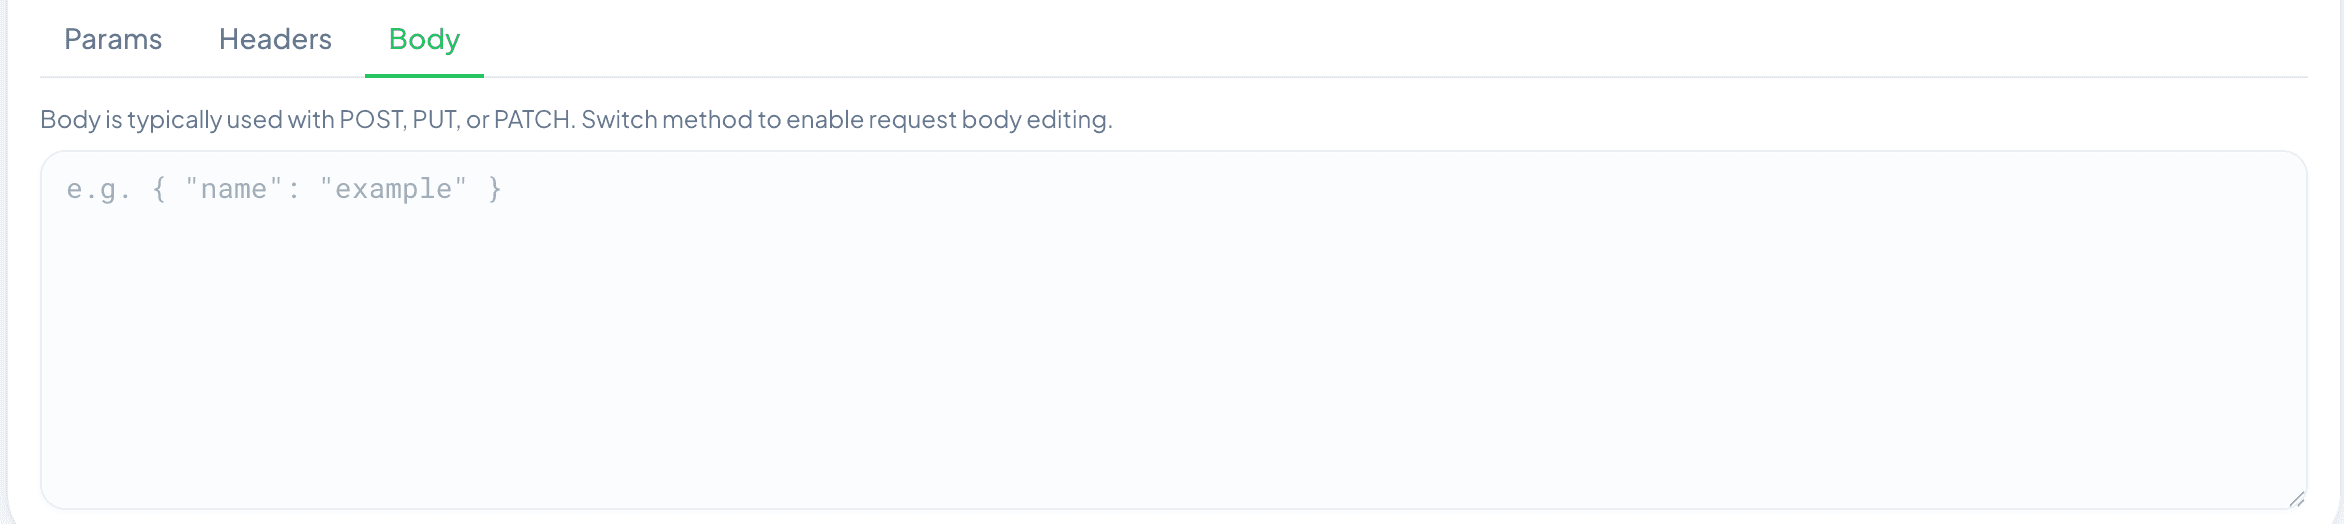
Provide a JSON object for POST, PUT, or PATCH requests.
05Import from curl or Postman (optional)
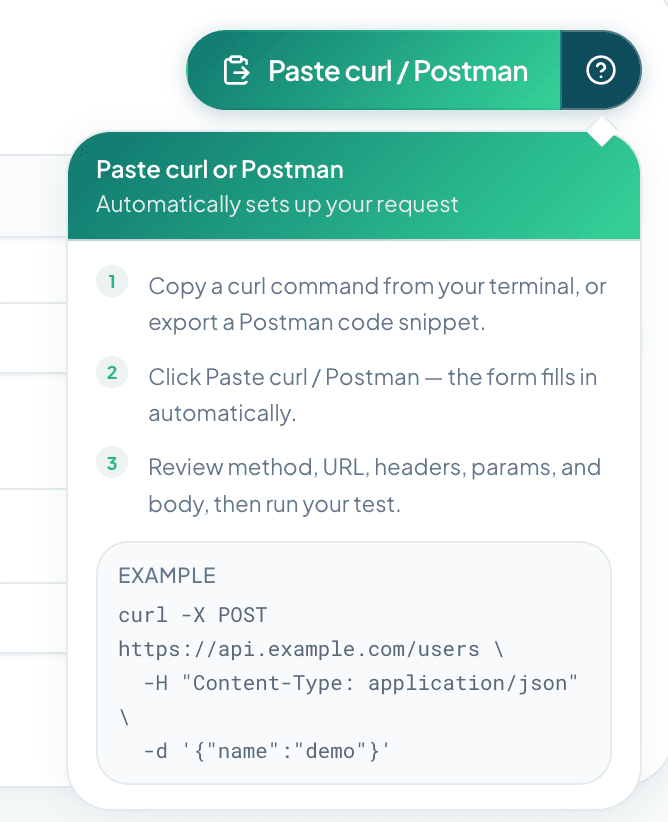
Click Paste curl / Postman. Loadcurl parses the snippet into method, URL, headers, params, and body. Use the help icon on the button for an example. OpenAPI import is not available in the current product.
06Set load configuration
Set duration, ramp-up, and target RPS. RPS is capped by your current plan unless your account is unrestricted. Before start, the dashboard checks remaining wallet requests (duration × RPS). If quota is too low, the run does not start.
- Target traffic (RPS) — requests sent each second at peak.
- Ramp-up time — seconds to reach target RPS (0 starts immediately).
- Test duration — how long the run lasts (minimum 30 seconds).
- Test preview — estimated total requests before you start.

07Start, stop, and open the run
Click Start test. The backend creates the scenario and the dashboard opens the run page. Status moves through pending, provisioned, and running, then completed, failed, or stopped. Use Stop while the test is still live. Starting also places a hold on wallet requests until the run settles, and refreshes subscription, ledger, and holds.
- Start test — checks wallet quota, creates the run, and begins sending traffic.
- Stop — ends a running test early from the run page.
- History — search and filter runs, then open a run for live events or the report.
08Live events, reports, and dashboard extras
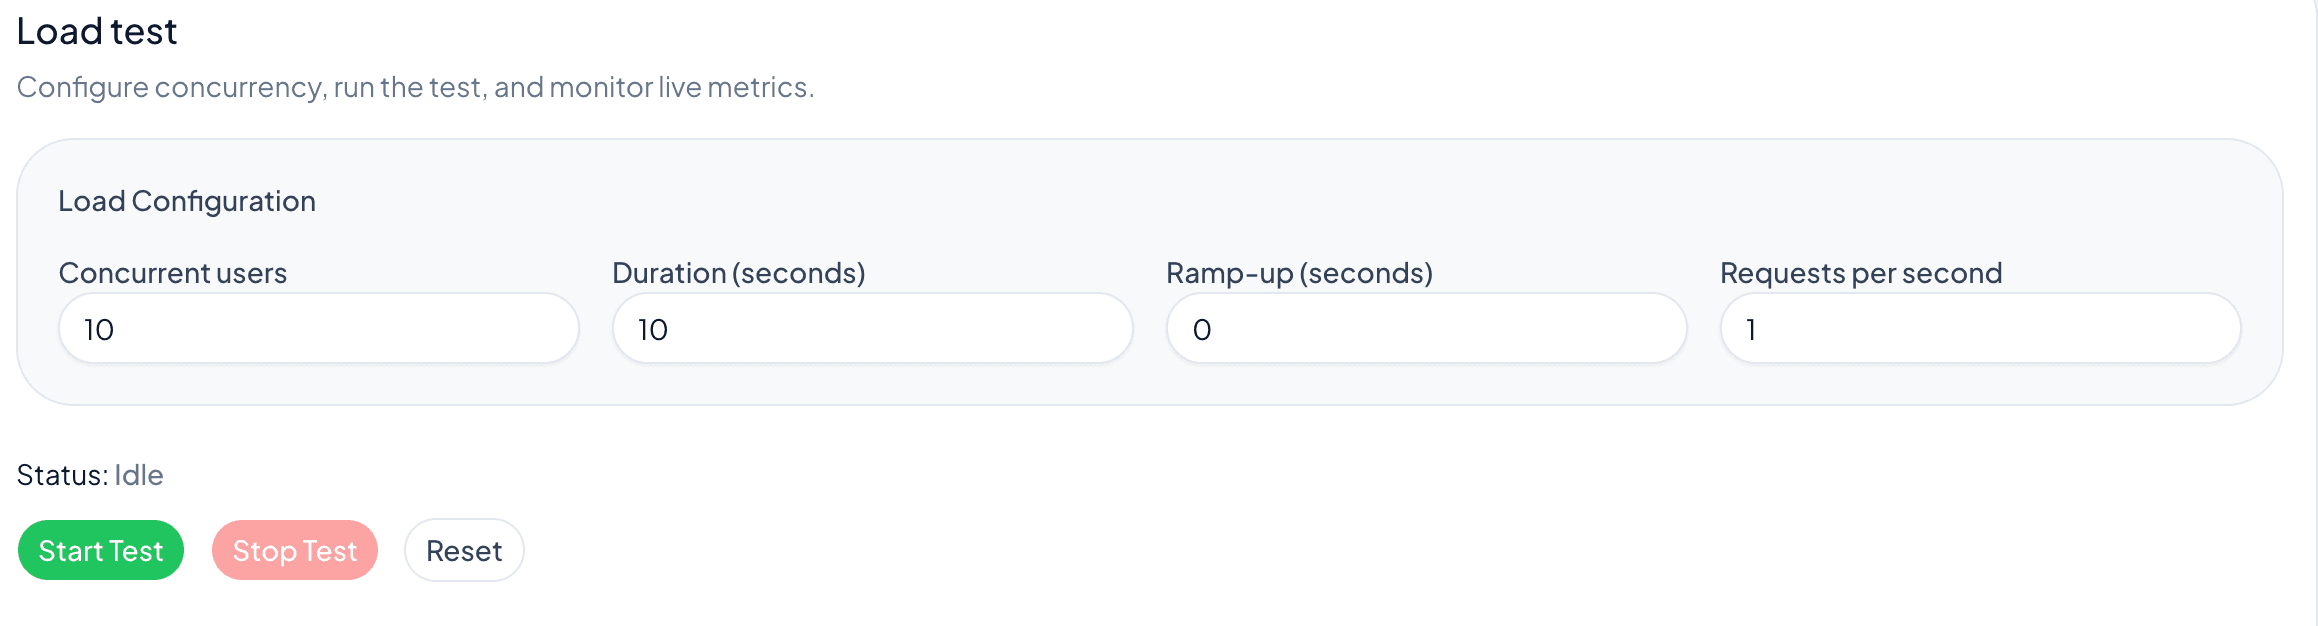
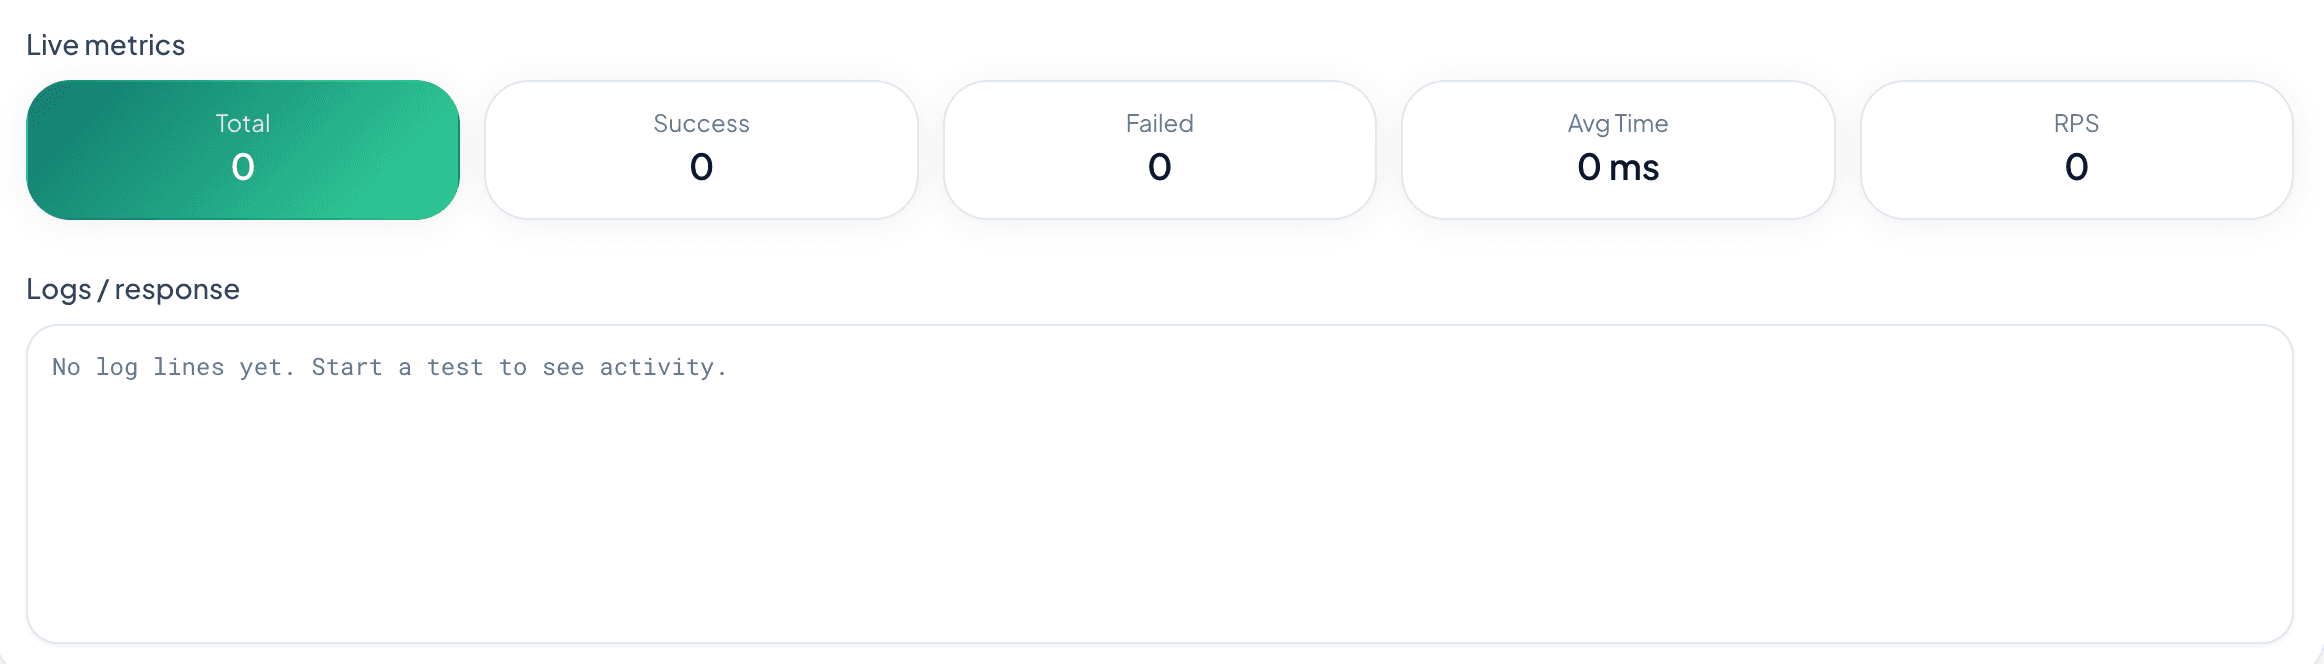
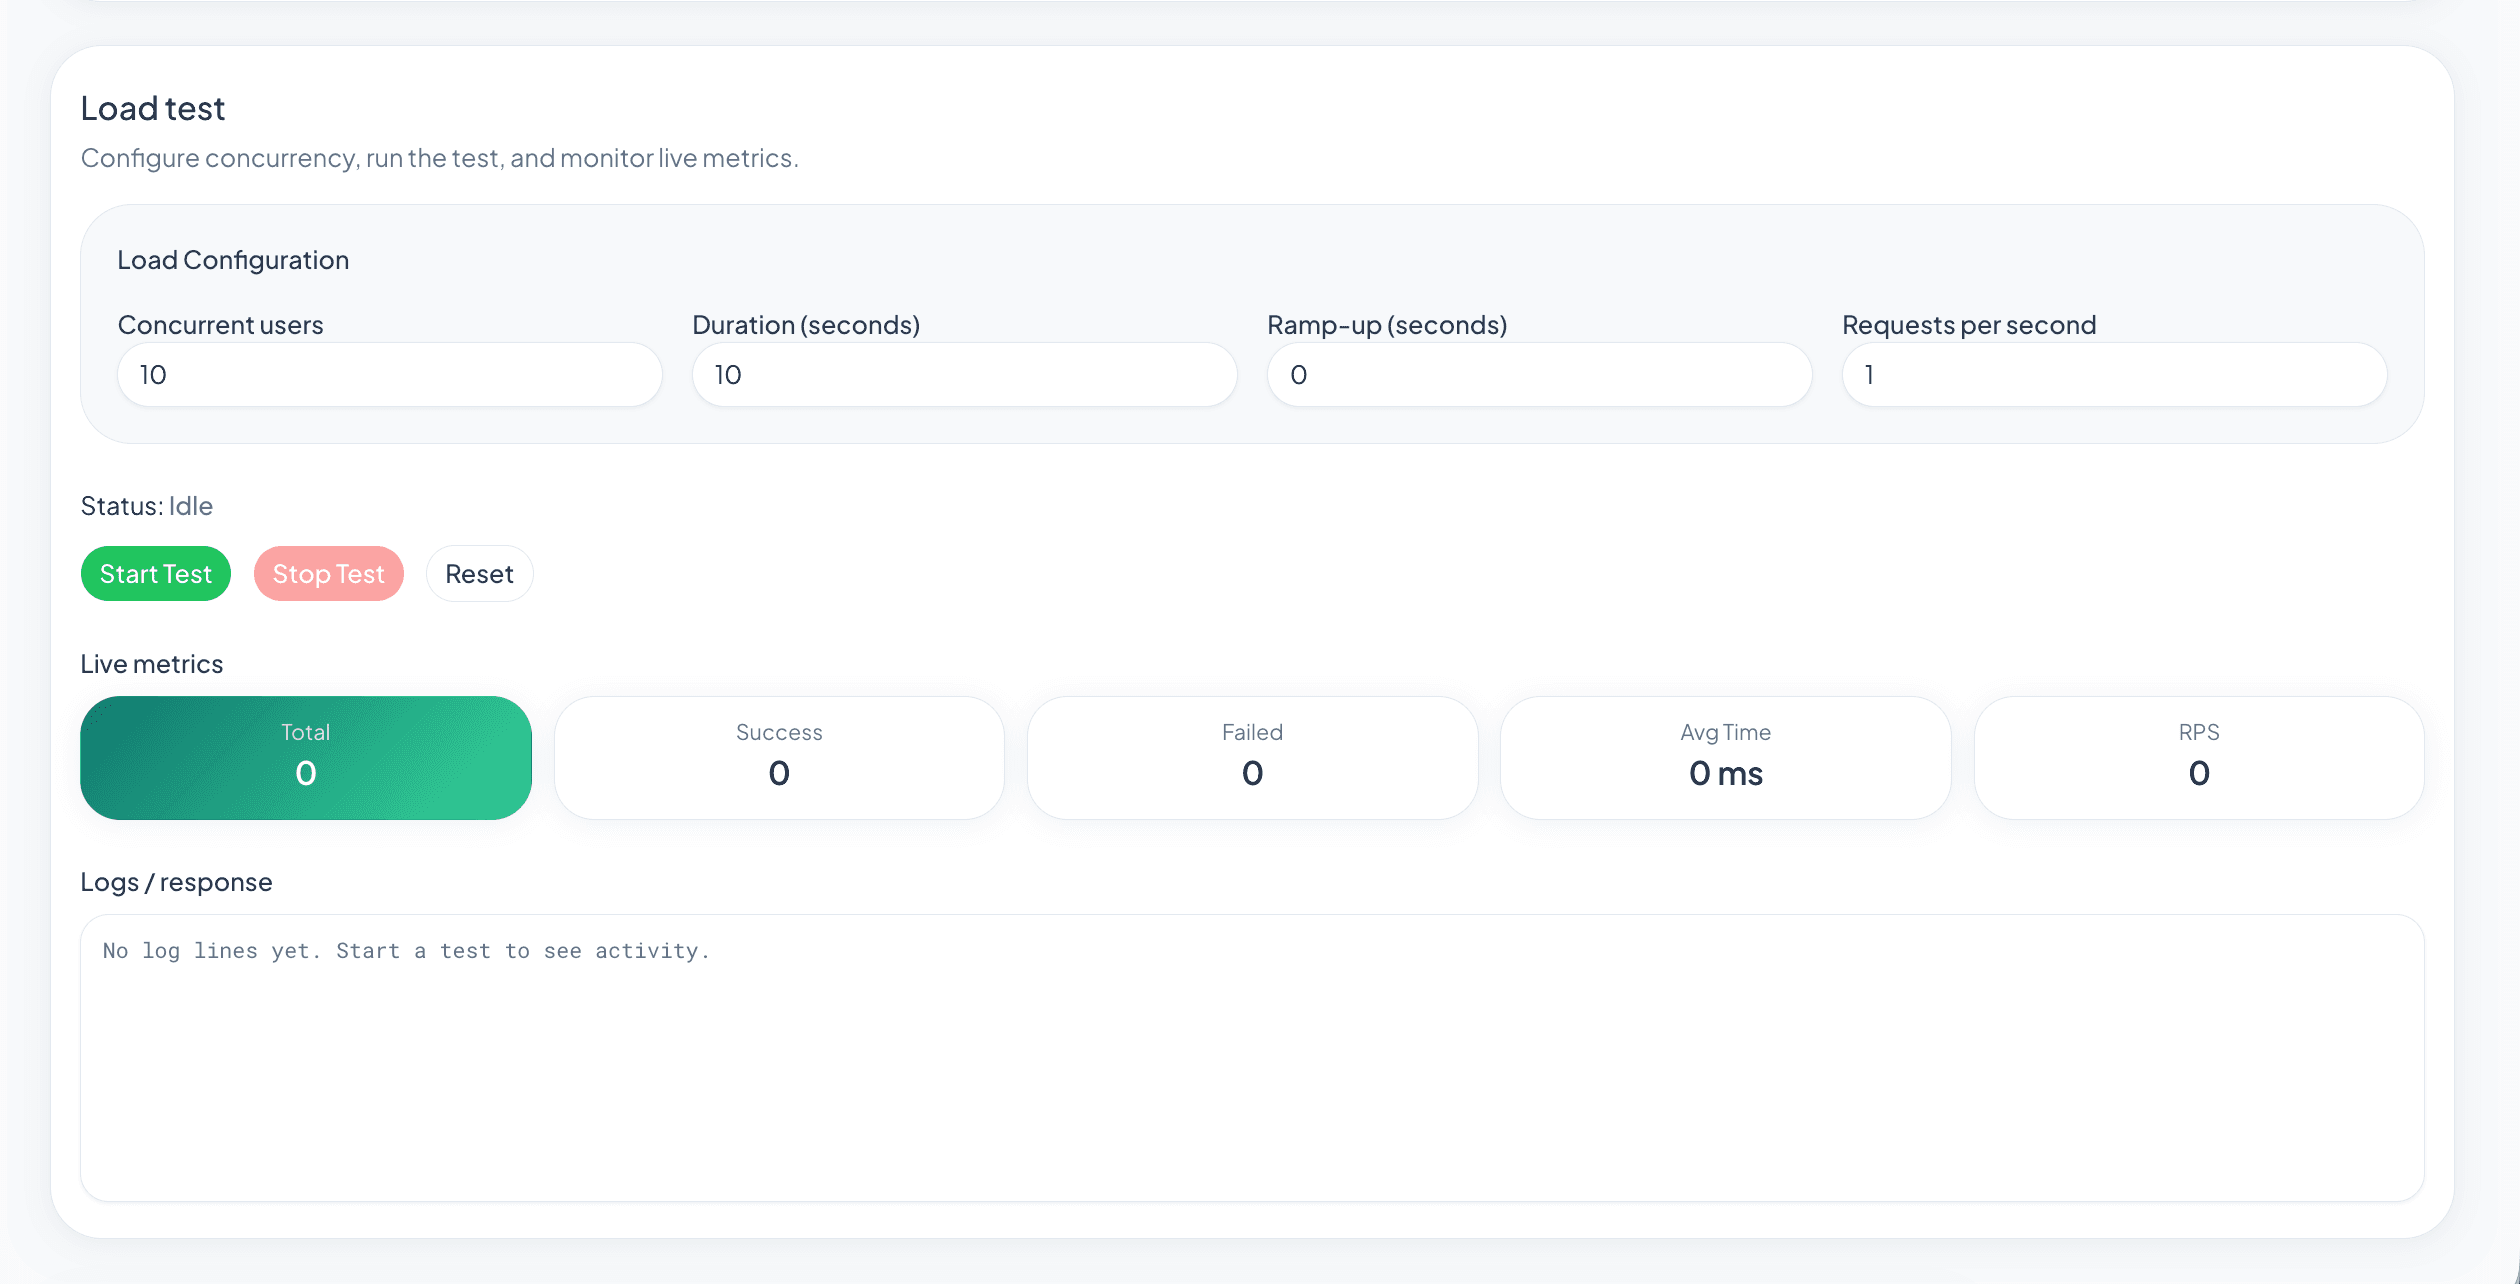
The run page does not use websockets. It polls every 3 seconds: live status while pending, provisioned, or running, then the report after the test finishes. Status history is grouped into created, resources, testing, and report (plus failed or stopped). Live cards show totals, success, failed, latency, and RPS. The finished report includes request summary, throughput vs target RPS, latency percentiles, and PDF download.
From the same app you can manage Settings (password, email verification, sessions), Profile, Billing, Wallet, and in-app notifications. Inbox notifications are separate from the run event timeline. Company members share tests, wallet, and subscription.
- Live status — polled every 3 seconds while pending, provisioned, or running.
- Event timeline — created, resources, testing, report, or failed/stopped.
- Report — p50–p99, HTTP 2xx–5xx, success and timeout rates, PDF download.
- Sessions — Settings → revoke one device or log out other devices.
- Wallet — allotted / available / held / used request quota; ledger and payments.
- Billing — plan catalog by market and Razorpay checkout (Owner/Admin); queue or cancel as needed.
Ready to test?
Open the dashboard, compose a test on Home, and run your first load profile. The run page polls every 3 seconds, then the report. Upgrade to a company from Settings when you want to invite teammates. Billing, Wallet, sessions, and inbox notifications live in the same app.